Problem
At Freshworks, we were alerted to a recurring pod restart on a Python Flask web server. I could not find any issue in the logs at the first alert. However, the same alert reappeared for the same server the next month. This time, I was pretty sure that something fishy was going on.
I checked the logs and the infra-monitoring dashboard for the last hour; nothing fishy was there. Then, to increase the scope, I checked the memory usage of the pods from one hour to one day and then from one day to one week.

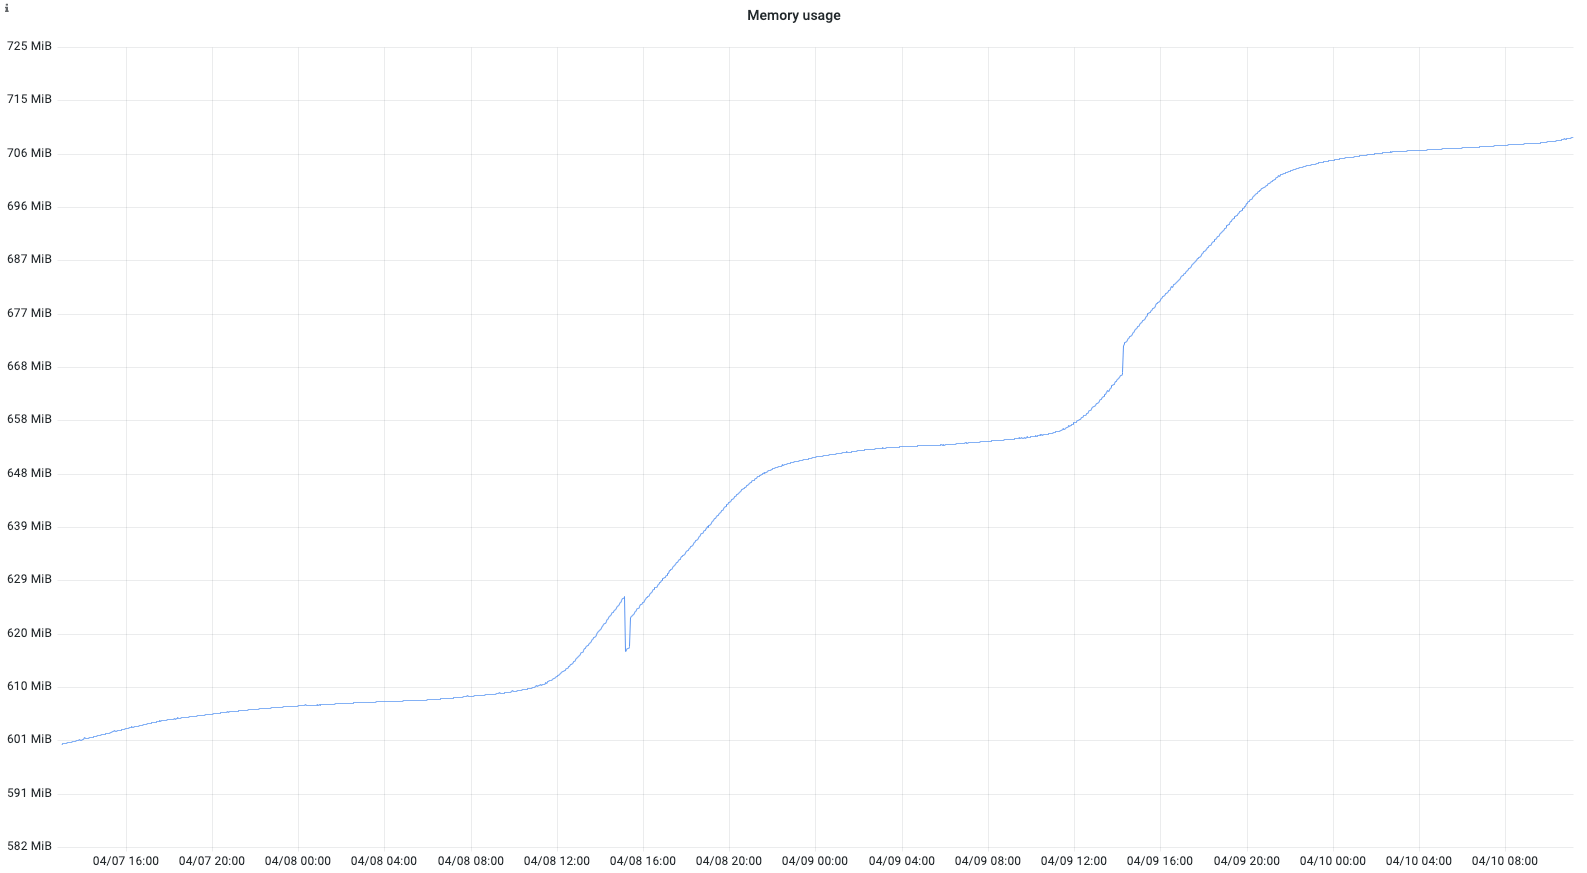
Figure 1: Memory usage of a Server pod in three days, from ~600MB to ~700MB.
The Server’s memory usage was increasing. It often crossed the maximum allocated memory size, causing the pod to restart. This restart caused an occasional API request loss. The server has many APIs. The next challenge was to pinpoint the exact location of the leak.
Leak Detection
This was a slowly accumulating memory leak over a month. These are generally hard to detect. I tried to scope down the leak circumstances.
Scoping down the leak
1st Hint
- Based on the chart pattern in Figure 1, it was evident that when there were active requests, memory usage increased, i.e., during non-peak hours like 11 PM to 9 AM, the memory usage of the chart was almost flat.
- There was a positive correlation between API requests and memory usage.
- API request-independent programs were not responsible for this leak.
2nd Hint
- There was another Grafana chart where we recorded how many requests per API were received.
- After manually checking both charts at minute intervals, I found that a specific API was positively correlated with memory usage.
- I scoped down the memory leak search only to this API request.
Code changes
- This was a live server. We could not stop it or reproduce the leak in the staging environment, and we could not degrade the performance either. If the server had gone down, it would have been classified as a P0 incident. Trust me, you do not want to create a P0 incident.
- I used a built-in library, Tracemalloc, to detect the memory leak.
- As a CFP reviewer in PyCon India 2019, one of the talks I selected was Debug Memory Leak In Python Flask.
- In this talk, the speaker, Sanket Patel, explained a similar scenario happened at LinkedIn.
- I revisited this talk and took inspiration to resolve this memory leak.
PyCon India 2019 Talk - Debug Memory Leak In Python Flask
+ import tracemalloc
from loguru import logger


memory_snapshot = None


@handle_exception
@process_request(PredictionRequestValidator, expect_body=False)
def get(self, request_params):
+    global memory_snapshot
+    tracemalloc.start()
    ... # Code logic
+    if not memory_snapshot:
+        memory_snapshot = tracemalloc.take_snapshot()  # Take a snapshot of the current memory usage
+        logger.info("memory_snapshot is taken.")
+    else:
+        lines = []
+        top_stats = tracemalloc.take_snapshot().compare_to(memory_snapshot, "lineno")
+        for stat in top_stats[:10]:
+            lines.append(str(stat) + "\n")
+        logger.info(f"{lines=}")
+        logger.info(f"{top_stats=}")
    return final_response, 200
Logs
Top 10 highest memory used lines on day 1 of the code change
'/opt/conda/lib/python3.8/site-packages/prometheus_flask_exporter/__init__.py:943: size=5120 KiB (+5120 KiB), count=1 (+1), average=5120 KiB\n',
'/app/aiqcommon/utils/log.py:128: size=3305 KiB (+3304 KiB), count=141003 (+140974), average=24 B\n',
'/opt/conda/lib/python3.8/site-packages/codetiming/_timers.py:26: size=1131 KiB (+1130 KiB), count=4 (+0), average=283 KiB\n',
'/opt/conda/lib/python3.8/json/decoder.py:353: size=209 KiB (+183 KiB), count=3310 (+2963), average=65 B\n',
'/opt/conda/lib/python3.8/site-packages/jsonschema/validators.py:251: size=144 KiB (+142 KiB), count=1 (-8), average=144 KiB\n',
'/opt/conda/lib/python3.8/tracemalloc.py:111: size=131 KiB (+131 KiB), count=1682 (+1682), average=80 B\n',
'/opt/conda/lib/python3.8/tracemalloc.py:532: size=57.5 KiB (+57.4 KiB), count=1149 (+1148), average=51 B\n',
'/opt/conda/lib/python3.8/asyncio/streams.py:687: size=69.3 KiB (+50.3 KiB), count=11 (+8), average=6453 B\n',
'/opt/conda/lib/python3.8/tracemalloc.py:185: size=32.8 KiB (+32.8 KiB), count=699 (+699), average=48 B\n',
'/opt/conda/lib/python3.8/site-packages/prometheus_client/metrics.py:250: size=37.1 KiB (+32.6 KiB), count=238 (+211), average=160 B\n'
Top 10 highest memory used lines on day-5 of the code change
'/app/aiqcommon/utils/log.py:128: size=7252 KiB (+7251 KiB), count=309391 (+309362), average=24 B\n',
'/opt/conda/lib/python3.8/site-packages/prometheus_flask_exporter/__init__.py:943: size=5120 KiB (+5120 KiB), count=1 (+1), average=5120 KiB\n',
'/opt/conda/lib/python3.8/site-packages/codetiming/_timers.py:26: size=2580 KiB (+2579 KiB), count=4 (+0), average=645 KiB\n',
'/opt/conda/lib/python3.8/json/decoder.py:353: size=219 KiB (+193 KiB), count=3453 (+3106), average=65 B\n',
'/opt/conda/lib/python3.8/tracemalloc.py:111: size=155 KiB (+155 KiB), count=1988 (+1988), average=80 B\n',
'/opt/conda/lib/python3.8/site-packages/jsonschema/validators.py:251: size=144 KiB (+142 KiB), count=1 (-8), average=144 KiB\n',
'/opt/conda/lib/python3.8/asyncio/streams.py:687: size=75.4 KiB (+56.3 KiB), count=12 (+9), average=6431 B\n',
'/opt/conda/lib/python3.8/tracemalloc.py:532: size=53.3 KiB (+53.2 KiB), count=1088 (+1087), average=50 B\n',
'/opt/conda/lib/python3.8/site-packages/prometheus_client/metrics.py:250: size=46.5 KiB (+42.1 KiB), count=284 (+257), average=168 B\n',
'/opt/conda/lib/python3.8/site-packages/h11/_util.py:92: size=50.7 KiB (+41.8 KiB), count=463 (+375), average=112 B\n'
Observation
- The _timers.py size got increased from 1131KiB to 2580KiB.
- The log size increased from 3305KiB to 7252KiB.
Fix
- For the first observation, after checking the _timers.py file. This is a file about the library, codetiming.
- For the second observation, the TimerMetrics class defined over log.py was causing memory leakage.
- In the Flask server, we log TimerFunc stats every minute by calling the get_aggregated_timings method.
- In this function, we have a statement
TimerMetrics.timers.clear(), which clears out the memory of TimerFunc. - We are not calling this statement, which caused an accumulation of memory consumption over time.
- As we no longer use this library in the server to check the method execution latencies (Prometheus does that now), I removed this library usage.
Postfix

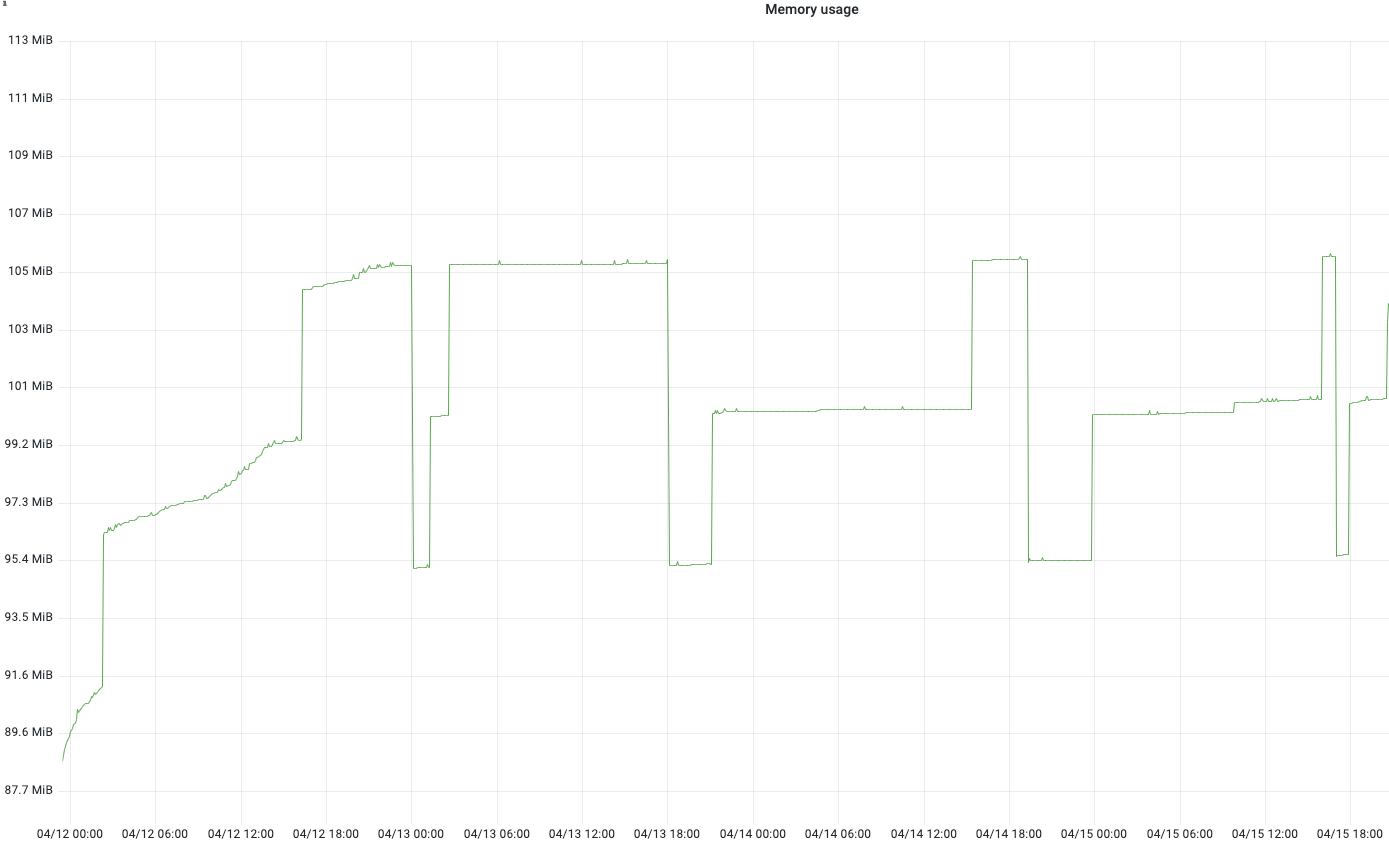
Figure 2: The memory usage after the fix
- Memory usage almost remained constant.
- The memory growth rate has decreased.
Conclusion
In this post, we went through identifying a memory leak, scoping down and fixing the leak. Here, we have used tracemalloc library to haunt the leak.

