Advancing AI Observability: From Metrics to Meaningful Insights
Building on our production readiness checklist, this post dives deeper into practical strategies for instrumenting and monitoring AI systems. Earlier I shared a Production Readiness Checklist outlining the essential steps before rolling an AI system into production. One key section focused on observability and tracing. This post expands on that foundation, adding hands‑on examples, code snippets, and real‑world war stories so you can move from aspirational slides to shipping dashboards. Modern AI applications — from Retrieval‑Augmented Generation (RAG) pipelines to fine‑tuned LLMs — are complex socio‑technical systems. Standard application metrics alone aren’t enough when a slight model‑drift or data‑quality issue can torpedo business outcomes. Headline stats worth sharing with the board • 30 % of generative‑AI pilots will be abandoned after proof‑of‑concept by 2025 because of poor data, inadequate risk controls, or unclear value [1] • 88 % of enterprises say a single hour of downtime now exceeds $300 k — and 34 % report $1–5 million per hour [2] • Large organisations already spend a median $1.4 million per year on AIOps & observability tooling [3] • Early adopters are realising $3.7 in value for every $1 invested in generative‑AI programmes [4] Zillow Offers famously wrote down $569 million and shuttered its home‑flipping arm after its price‑prediction model drifted in the frothy 2021 housing market [5]. Had Zillow continuously monitored prediction error against market movement and flagged drift early, it could have throttled purchases before the losses snowballed. Share this cautionary tale whenever someone claims “it’s just a proof of concept.” Instrumentation is the groundwork. Capture the right signals from your application code, model‑serving layers, and data pipelines at the point they happen, not in an after‑the‑fact batch. The snippet auto‑instruments FastAPI, Requests, and LangChain using OpenTelemetry so every RAG span, latency, and token count lands in your tracing backend in <5 lines of code [6]. Enable log/trace correlation with a single env‑var ( Tip Create a lightweight Metrics are only useful when actionable. Build dashboards that combine system health with AI‑specific indicators. In The Hidden Cost of LLM‑as‑a‑Judge we discussed smart approaches to LLM evaluation. Observability ties into that by storing evaluation results alongside live metrics. Arize’s online evaluation feature attaches these scores directly to each trace so you can slice dashboards by factuality, toxicity, or “hallucination probability” in real time [10]. For open‑source stacks, Evidently AI 0.4+ now supports LLM testing suites with >100 metrics, drift reports, and a self‑hosted monitoring UI [11]. AI observability is a living discipline. By moving beyond simple metrics and focusing on actionable insights, you ensure your models stay reliable and aligned with business goals—and you build the confidence executives need to keep funding your roadmap. Need expert support? Contact me to discuss how tailored observability practices can accelerate your AI roadmap. https://www.gartner.com/en/articles/highlights-from-gartner-data-analytics-summit-2024 ↩ https://blogs.microsoft.com/blog/2024/11/12/idcs-2024-ai-opportunity-study-top-five-ai-trends-to-watch/ ↩ https://www.axios.com/2021/11/02/zillow-abandon-home-flipping-algorithm ↩ https://opentelemetry.io/docs/languages/python/getting-started/ ↩ https://opentelemetry.io/docs/zero-code/python/configuration/ ↩ https://learn.microsoft.com/en-us/azure/ai-services/openai/how-to/monitor-openai ↩ https://www.evidentlyai.com/blog/open-source-llm-evaluation ↩
    flowchart LR
Users --> AI-Application --> Observability
Why Observability Matters
Real‑World Failure Case
    flowchart LR
Production --> Observation --> Business-KPI
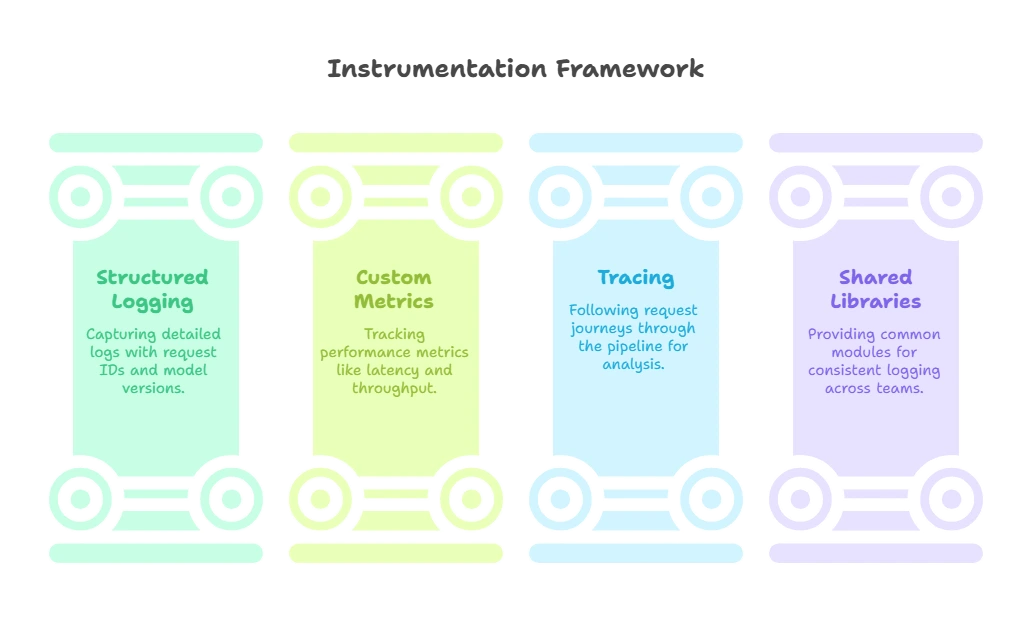
Pillars of AI Observability
1. Instrumentation (Deep Dive)
# FastAPI + LangChain example with OpenTelemetry
=
=
=
=
return
OTEL_PYTHON_LOG_CORRELATION=true) so JSON logs include the active trace‑ID [7].observability internal package that wraps the boilerplate so teams can add a single import and two lines of config. Example Structured Log (truncated)
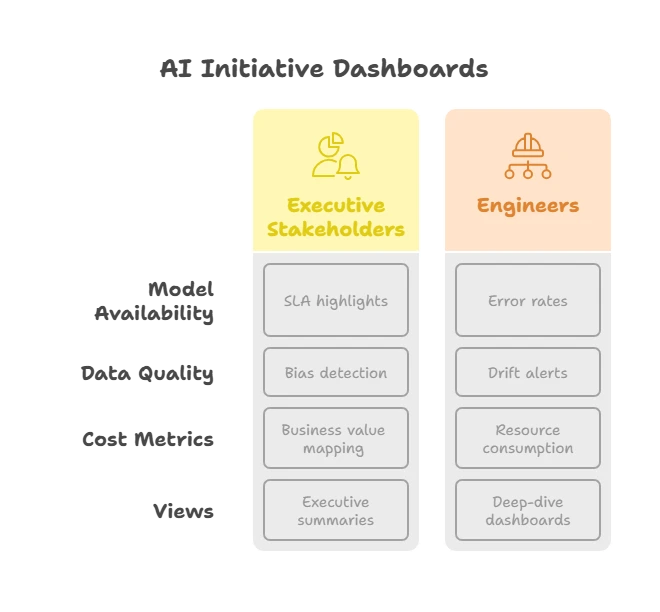
2. Monitoring and Dashboards (Deep Dive)
Layer Key Metrics Example PromQL Alert Threshold API & Gateway http_request_duration_seconds{route="/ask"} (p95)histogram_quantile(0.95, rate(http_request_duration_seconds_bucket[5m]))>2 s for 5 m Model Serving rag_tokens_total by model & customersum by(model)(rate(rag_tokens_total[1h]))20 % ↑ from 30‑day baseline Retrieval Store vector_query_latency_ms p99histogram_quantile(0.99, rate(vector_query_latency_ms_bucket[5m]))>300 ms Cost rag_cost_usd_totalincrease(rag_cost_usd_total[1d])>$1k/day budget 3. Closing the Loop with Evaluation
# arize‑evals.yaml – evaluate 5 % of prod traffic nightly
project: ai‑assistant
source: prod‑llm‑traces
sample_rate: 0.05
checks:
  - name: factuality
    type: rouge
    threshold: 0.25
  - name: toxicity
    type: perspective
    threshold: 0.10
sink: arize‑cloud
schedule: "0 2 * * *"
    flowchart LR
Metrics --> Evaluation
Evaluation -->|compare| Newer
Newer --> Retrain
Putting It All Together
tokens * price_per_token for every request. Kill features that deliver low ROI. Auto‑scale GPU pods based on real‑time throughput.
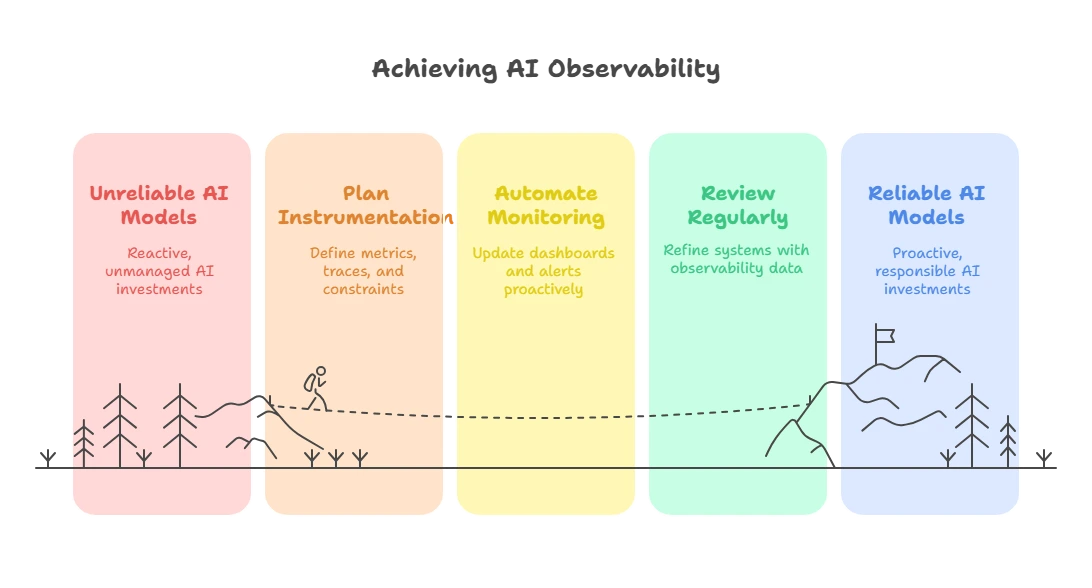
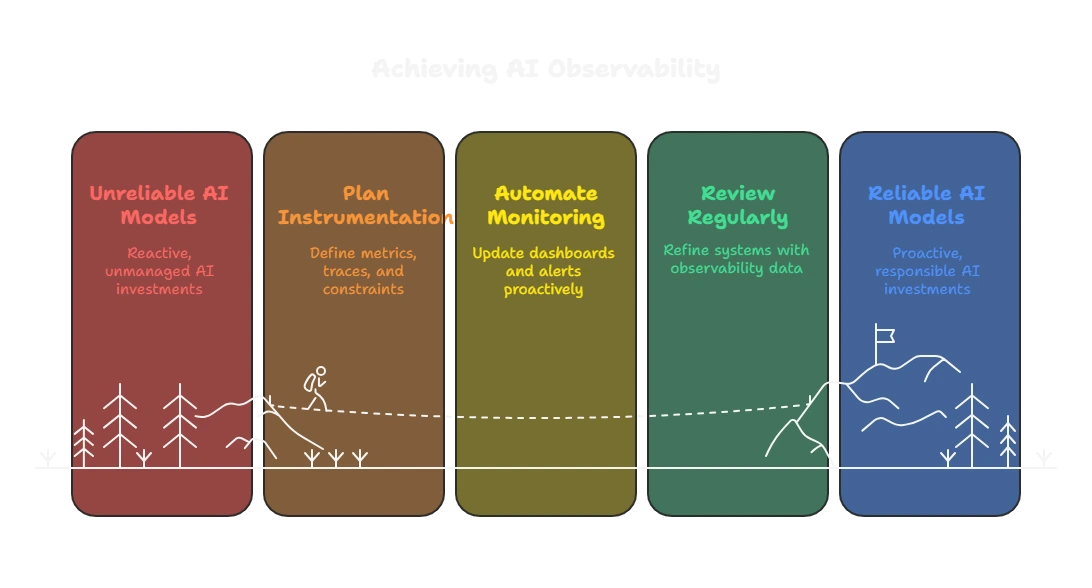
    flowchart LR
Plan --> Automate --> Review --> Improve
Related Articles